Essential Excel Formulas for Data Analysts: Complete 2025 Guide

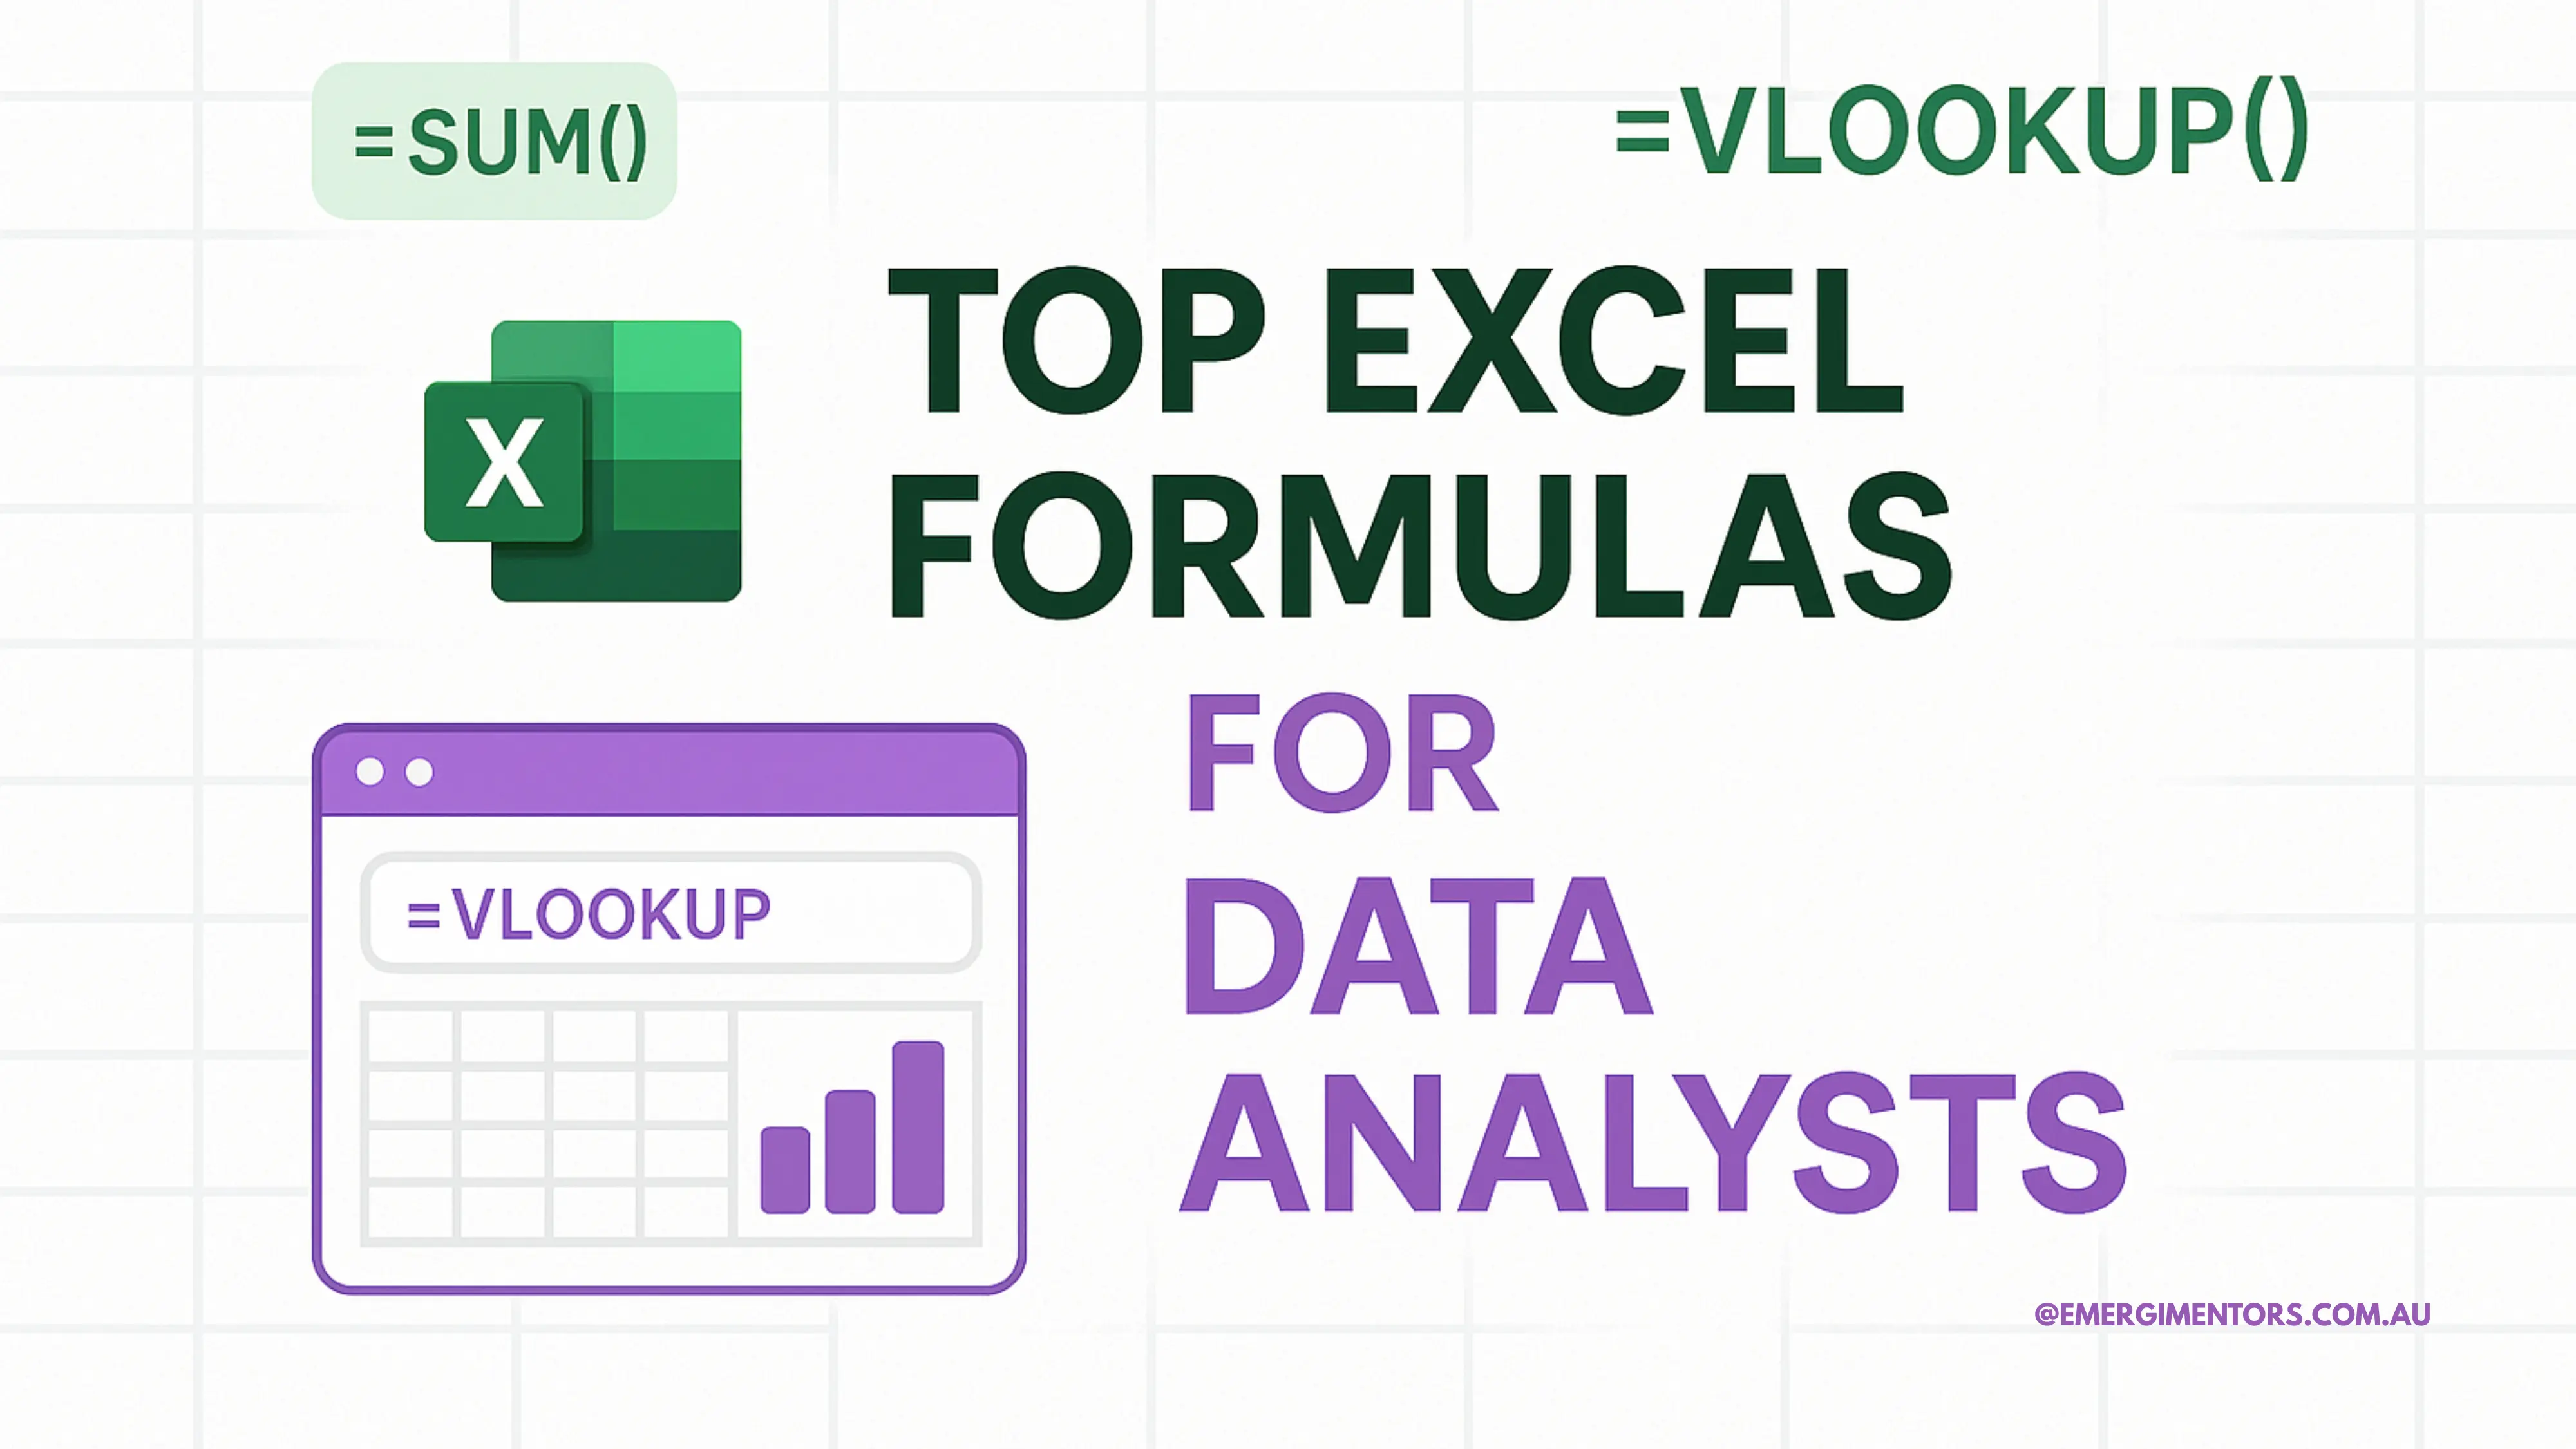
Despite the rise of advanced analytics tools, Excel remains the cornerstone of data analysis across industries. Whether you're starting your analytics journey or looking to strengthen your foundation, mastering these essential Excel formulas for data analysts will transform how you work with data and accelerate your career growth.
The Foundation: Statistical Functions That Tell Your Data's Story
Every meaningful analysis begins with understanding your data's basic characteristics. These fundamental Excel formulas for data analysts form the backbone of statistical analysis. The AVERAGE() function gives you the central tendency, but pair it with MEDIAN() to understand if outliers are skewing your results. For instance, when analyzing sales performance, the median often provides a more realistic picture than the average when a few high performers dominate the numbers.
Don't overlook STDEV() for measuring variability; it's crucial for understanding data consistency and reliability. A low standard deviation in customer satisfaction scores tells a different story than a high one, even with identical averages.
Master the COUNT Family for Data Quality
Data quality determines analysis accuracy, making the COUNT functions your first line of defense. COUNTIF() goes beyond simple counting use =COUNTIF(B:B,">1000") to quickly identify high-value transactions or =COUNTIFS(Region,"North",Status,"Complete")for multi-criteria analysis.
These functions are invaluable for data validation. Before diving into complex analysis, use COUNTA() to check completeness and COUNT() to verify numeric data integrity.
Lookup Functions: Your Data Retrieval Toolkit
While VLOOKUP() remains popular, modern analysts should embrace INDEX/MATCH for its flexibility and superior performance. Unlike VLOOKUP's left-to-right limitation, INDEX/MATCH works in any direction: =INDEX(C:C,MATCH(E2,A:A,0)).
For Excel 365 users, XLOOKUP() represents the future of data retrieval. It handles missing values gracefully and eliminates many common VLOOKUP errors. However, since not all organizations have upgraded, mastering INDEX/MATCH ensures compatibility across platforms. For a comprehensive reference of all Excel functions, check Excel's official documentation to stay updated with the latest features and syntax.
Conditional Logic: Making Your Data Smart
Transform static data into intelligent insights with conditional functions. SUMIFS() and AVERAGEIFS() are powerhouses for creating dynamic reports. Instead of manually filtering data, use =SUMIFS(Revenue,Region,"West",Date,">=1/1/2024") to automatically calculate regional performance for specific periods.
Always wrap potentially problematic formulas with IFERROR(). Professional analysts build robust spreadsheets that handle missing data gracefully: =IFERROR(VLOOKUP(A2,Table1,2,FALSE),"Not Found").
Text Functions: Cleaning Data Like a Pro
Real-world data is messy. TRIM() removes problematic spaces, while SUBSTITUTE() standardizes variations in text data. Use LEFT(), RIGHT(), and MID() to extract specific portions that is perfect for parsing product codes or creating consistent formatting.
The CONCATENATE() function (or the simpler & operator) helps create unique identifiers by combining fields: =A2&"-"&B2 creates compound keys for analysis.
Date Functions: Unlocking Time-Based Insights
Temporal analysis reveals trends that static snapshots miss. Extract date components with YEAR(), MONTH(), and DAY() to create period-based summaries. Use =SUMIFS(Sales,MONTH(Dates),6) to analyze June performance across multiple years.
DATEDIF() calculates precise differences between dates, essential for customer lifecycle analysis and project duration calculations.
Building Dynamic Dashboards
Professional analysts create self-updating reports using OFFSET() for expanding ranges and INDIRECT() with dropdown lists for interactive filtering. These techniques can transform static spreadsheets into robust business intelligence tools.
The Modern Excel Advantage
Excel 365 introduces game-changing functions like UNIQUE(), FILTER(), and SORT() that eliminate manual data manipulation. These array functions process entire datasets instantly, bringing spreadsheet capabilities closer to dedicated analytics platforms.
Your Next Steps in Data Analytics
Mastering these excel formulas for data analysts provides a solid foundation, but data analytics extends far beyond spreadsheets. Today's analysts need skills in SQL, Python, statistical analysis, and data visualization tools like Tableau or Power BI.
The field can feel overwhelming when navigating alone. That's where expert mentorship becomes invaluable. Emergi Mentors connects aspiring analysts with industry professionals who provide personalized guidance, real-world projects, and career insights that accelerate your journey from Excel user to data analytics expert.
Ready to transform your knowledge of Excel formulas for data analysts into a thriving career? Expert mentorship could be the catalyst you need to make that leap with confidence.
Whether you're just starting or looking to advance, the right guidance can turn months of struggle into weeks of focused progress. Explore Data Analyst Mentors now.